Understanding the basics of technical analysis is essential for investors who want to make well-informed judgments in the fast-paced world of finance. Gaining a solid knowledge of the fundamental principles of technical analysis will help you navigate the complex world of financial markets with confidence and accuracy, regardless of experience level.
However, Technical analysis serves as a powerful tool for short-term trading strategies, it’s essential to recognize that it’s not the only option available.
Understanding the Basics of Technical analysis
Technical analysis is a way of assessing stocks by looking at data produced by market activity, like previous volume and prices. It is mostly used to predict price direction by analyzing historical market data, especially volume and price.
According to technical analysts, charts and other technical indications can be used to predict future action in the market.

Essential Terms of Technical Analysis
Understanding the Basics of Technical Analysis with frequently used essential terms is also important in technical analysis. Among these are a few of these:
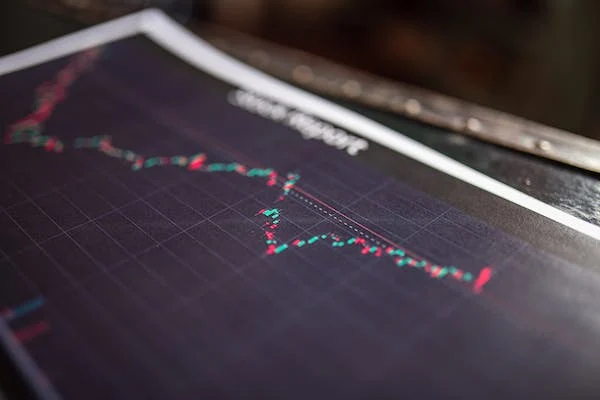
Charts: Line, bar, and candlestick charts are examples of graphical representations of price changes over a given period. With the help of these visual tools, traders may examine price trends and patterns and use that knowledge to make wise trading decisions.
Chart patterns: On a price chart, chart patterns are specific patterns that are thought to indicate future price movements. Triangles, wedges, and head and shoulders are typical chart designs.
Market Trend: The general pattern of a market is known as a trend. Trends may be sideways, upward, or downward.
Asset Price: The amount that an asset is being sold for at the moment is its price.
Asset Value: An asset’s value is determined by its base fundamentals. Value-oriented investors search out assets that are being sold for less than their true value (intrinsic value).
Support and Resistance: Support and resistance are points on a price chart where the price either finds it difficult to rise above (resistance) or falls below (support).
Moving averages: It is a technical indicator used to spot trends, moving averages can be useful to traders in determining when to enter and quit a trade.
Indicators: Indicators are computations based on mathematics that predict future changes in pricing. The stochastic oscillator, Super Trend, Fib Retracement, moving average convergence divergence (MACD), and relative strength index (RSI) are a few examples of indicators.
Although Technical Analysis is not a flawless science, technical analysis can be a helpful tool for spotting possible trading opportunities.
Formulating a Trading Plan
Technical analysis and risk management ideas are combined to create a winning trading strategy that maximizes profits and minimizes losses.
The following actions can be taken to create a solid trading strategy:
Establish Your Goals: Clearly state your time horizon, risk tolerance, and investment objectives so that your trading approach can be adjusted appropriately.
Research: Stay informed of happenings in the market, the economy, and geopolitics that could affect your choice of investments.
Backtesting: Analyze the performance of your trading strategy by testing it with past data, then make adjustments to your plan depending on previous performance.
Risk management: To safeguard your money and lessen possible losses, use risk management strategies like position sizing and stop-loss orders.
Even though technical analysis is a useful tool for investors and traders, it’s important to recognize its limitations to make wise choices in the financial markets.
Limitations of Technical Analysis
These are a few significant restrictions on technical analysis:
The personal perspective: A major component of technical analysis is the personal assessment of charts and patterns. The same data may be interpreted differently by different analysts, resulting in differing conclusions and trading approaches.
Past Data: To forecast future price movements, technical analysis mainly makes use of past price and volume data. However past performance does not guarantee future performance, and past trends become less dependable due to shifting market conditions.
Market Volatility: A wide range of factors, such as investor emotions, geopolitical developments, and economic statistics, have an impact on financial markets. It can be difficult to notice significant trends due to this volatility, which may additionally bias pricing patterns.
Bogus signals: Technical indicators and chart patterns are at risk of Bogus Signals, which are instances in which prices abruptly change course. Traders who follow false or Bogus signals from technical analysis face the risk of losing money.
Absence of Fundamental Analysis: Technical analysis ignores fundamental elements like business earnings, current economic conditions, and industry trends instead of concentrating only on price and volume data.
Over-reliance on Indicators: Certain traders may rely too much on technical indicators, which can cause analytical paralysis or cause them to ignore other important information. Technical analysis must be applied within a more comprehensive investment framework that also includes risk management and fundamental analysis.
Weak Forecasting Power: Technical analysis is not a panacea for accurately projecting future price movements, but it can offer insightful information about market trends and patterns. Unexpected occurrences have the power to drastically alter the course of asset prices, and markets are not always predictable.
Upshot
The financial markets are always changing, giving traders new chances and difficulties. You must understand the basics of Technical Analysis first as a Beginner stay updated on market developments, and modify your trading technique as necessary if you want to stay ahead of the curve.
You can navigate the complicated world of finance with confidence and accuracy by learning the fundamentals of technical analysis and applying them to your trading. This will open up new avenues for financial success.
Also Read: Intraday vs. Delivery Trading: Which Strategy Will Make You Richer?


